· 14 min read
How many tickets do you need to sell to break even?

You need to sell enough tickets for the money left after refunds, fees and ticket-related costs to cover the event's remaining costs. Subtract confirmed net sponsorship income first, divide what remains by the contribution from each ticket, then round up to a whole ticket.
That gives you a useful answer only if you count the right costs and use the prices people will actually pay. A $50 ticket doesn't put $50 towards the venue bill. A room with 600 places doesn't give you 600 paid places. And selling all your cheap tickets first changes where break-even happens.
Let's work through four visual examples: reaching break-even, making a profit, making a loss and selling tickets in releases. Each uses the same event budget so you can see what changes. Every dollar figure below is a fictional USD example, not a fee quote, industry benchmark or customer result.
Example 1. Sell 396 tickets to break even
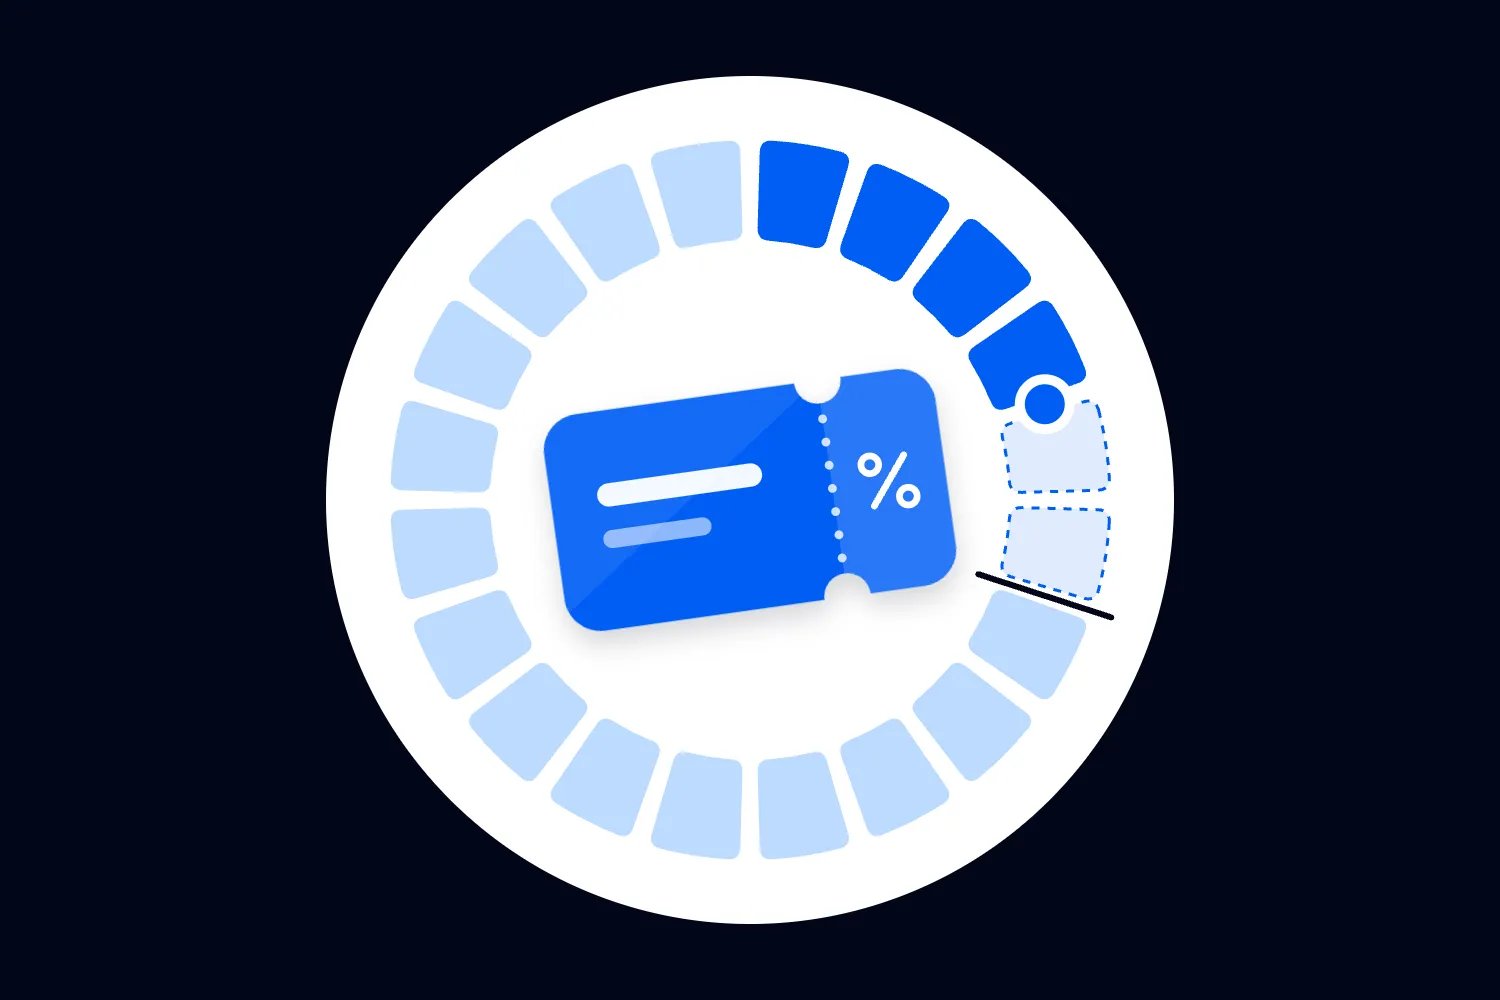
Divide the $15,160 still to cover by the $38.32 expected contribution per original paid sale. The answer is about 395.62, so round up to 396 ticket sales. At 395, the model shows a $23.60 loss. At 396, it shows a $14.72 surplus. That small surplus is the result of rounding up to a whole ticket.
The next sections show where both figures come from, including fees, refunds, complimentary guests and sponsorship.
Start with what each ticket contributes
The US Small Business Administration's break-even formula divides fixed costs by selling price minus variable cost. Fixed costs stay the same within the event size you're planning. Variable costs change as you sell or serve more tickets.
The amount left from each sale after its variable costs is its contribution. It pays towards your fixed costs until those are covered. After that, it adds to profit, provided selling more tickets doesn't trigger another cost.
For a simple event with $12,000 of fixed costs, $50 tickets and $10 of variable costs per ticket, each sale contributes $40. You need 300 tickets to cover $12,000. At 299 tickets, you're $40 short. At 300, you've broken even.
Don't divide $12,000 by the $50 ticket price and conclude you need 240 tickets. Those sales also create $2,400 of variable costs. You're still short by that amount.
Our main example adds the things a real paid-event budget needs to address. We'll use expected refunds, absorbed fees, complimentary tickets and confirmed sponsorship. The principle stays the same. Work out what tickets must cover, then what each sale contributes towards it.
Sort your costs before you calculate
Start with your event budget and classify each line by what makes it change. The supplier's name doesn't tell you whether a cost is fixed or variable. Its contract does.
Venue hire, an artist guarantee, insurance and an agreed production package may be fixed for this event. Catering charged per guest is variable. A caterer's minimum guarantee needs different treatment from an unrestricted per-head charge. Keep the minimum in fixed costs and model additional charges only above the agreed threshold.
Advertising needs the same care. A committed campaign budget belongs in fixed costs for this calculation. Commission charged on each ticket belongs with variable costs. Don't include your advertising budget and then deduct its average cost per sale again.
Include your own paid work and an appropriate share of business overhead if you want to know whether this event supports the business. A calculation that omits those costs answers a narrower question. Label it accordingly.
Some costs increase in steps. If attendance above a certain level requires another room or crew shift, calculate that scenario with the extra cost included. Check that the resulting ticket requirement falls inside the attendance range you used. Otherwise, the answer belongs to a different budget.
Keep collected taxes that you must remit out of money available to cover event costs. Use consistent tax treatment across prices, fees and supplier costs, checked against your own arrangements. Our worked example assumes no tax amounts require a separate adjustment.
Count sponsorship and complimentary tickets once
Suppose the event has $18,000 of fixed costs. A confirmed sponsor will pay $4,000, and delivering its package costs $1,000, including associated fees. The sponsor contributes $3,000 towards the event.
Subtract that $3,000 from the costs tickets must cover. The $18,000 must exclude the $1,000 already deducted from sponsorship. Otherwise, you've charged the same delivery costs twice. An unsigned proposal contributes zero to this confirmed-income version, however promising the conversation feels.
You can use the same approach for other income, but count the amount left after its associated costs. Bar takings are not all available to cover venue hire if you must buy the drinks and pay bar staff. Keep uncertain takings in a separate scenario.
Now add 20 complimentary guests, each costing $8 to serve. That's another $160 to cover, bringing the requirement to $15,160. Their costs sit outside paid-ticket variable costs because those guests produce no paid ticket sales.
Sponsor allocations need a clear home. In this example, the 20 complimentary guests exclude sponsor guests whose costs are already inside the $1,000 package delivery cost. If sponsor guests occupy the same room, their places must still reduce sellable capacity. Costs and occupied places are different counts.
For the capacity example below, assume the sponsor package uses no additional guest places. The room has 600 usable admission places, with 20 complimentary places and 10 production holds. That leaves 570 available for paid tickets. Staff or performers who reduce your actual permitted admission capacity must be accounted for before entering that capacity.
Include fees and expected refunds
Our standard ticket costs $50. The organizer absorbs a fictional fee of 3% of that price plus $0.50 per ticket. That makes the fee $2.00. These are illustrative assumptions, not Loopyah or payment-provider prices.
Check what your fee is charged on. A percentage applied to the full checkout total can differ from a percentage applied to the ticket price. A flat charge per order also differs from a flat charge per ticket. This example uses a per-ticket charge throughout.
If your charge is per order, divide it by expected tickets per order to estimate the per-ticket amount. That makes the result an estimate dependent on order size. Before trusting a tight threshold, recalculate against actual order counts. Don't silently treat a four-ticket order as four transaction charges.
Next, assume 4% of original paid tickets receive a full refund. Those tickets aren't resold in this model. Refunded buyers don't attend, and their $8 service cost is completely avoided. All original ticket fees remain payable. Any cost you cannot recover on a refunded ticket needs its own treatment.
Stripe's refund documentation says its original processing fees aren't returned. That illustrates why a refund can leave costs behind. Use your actual platform agreement to establish which fees you bear; don't assume every platform passes through the same refund treatment.
For each original sale, expected retained ticket revenue is $50 × 96%, or $48. Expected service cost is $8 × 96%, or $7.68. Subtract the original $2 fee and each sale contributes $38.32.
A no-show is different from a refund. A buyer who keeps their ticket but stays home still provides ticket revenue. Whether you save their service cost depends on your supplier terms. If meals are already ordered and payable, their absence saves nothing. This example charges the service cost for every retained paid ticket, whether its holder attends or not.
The refund assumption makes this an expected result, not a promise. You won't refund a fraction of a ticket in real life. The model estimates the financial effect across sales; actual refunds can move the outcome either way.
Example 2. Sell 450 tickets and make $2,084 profit
At 450 original paid sales, multiply the $38.32 contribution by 450. Tickets contribute $17,244 towards the event's remaining costs. Subtract $15,160 and you have $2,084 expected profit.
The gross ticket sales are $22,500, but some of that money goes back to buyers or pays fees and service costs. Our contribution calculation has already allowed for those deductions. The 4% refund assumption means 18 expected refunds and 432 retained paid tickets in this scenario.
If your target is $3,000 profit, add it to the $15,160 that tickets must cover. Divide $18,160 by $38.32 and round up. You need 474 original sales, which leave $3,003.68 expected profit. That's within the 570 paid places, but it still needs a credible sales forecast.
Example 3. Sell 300 tickets and make a $3,664 loss
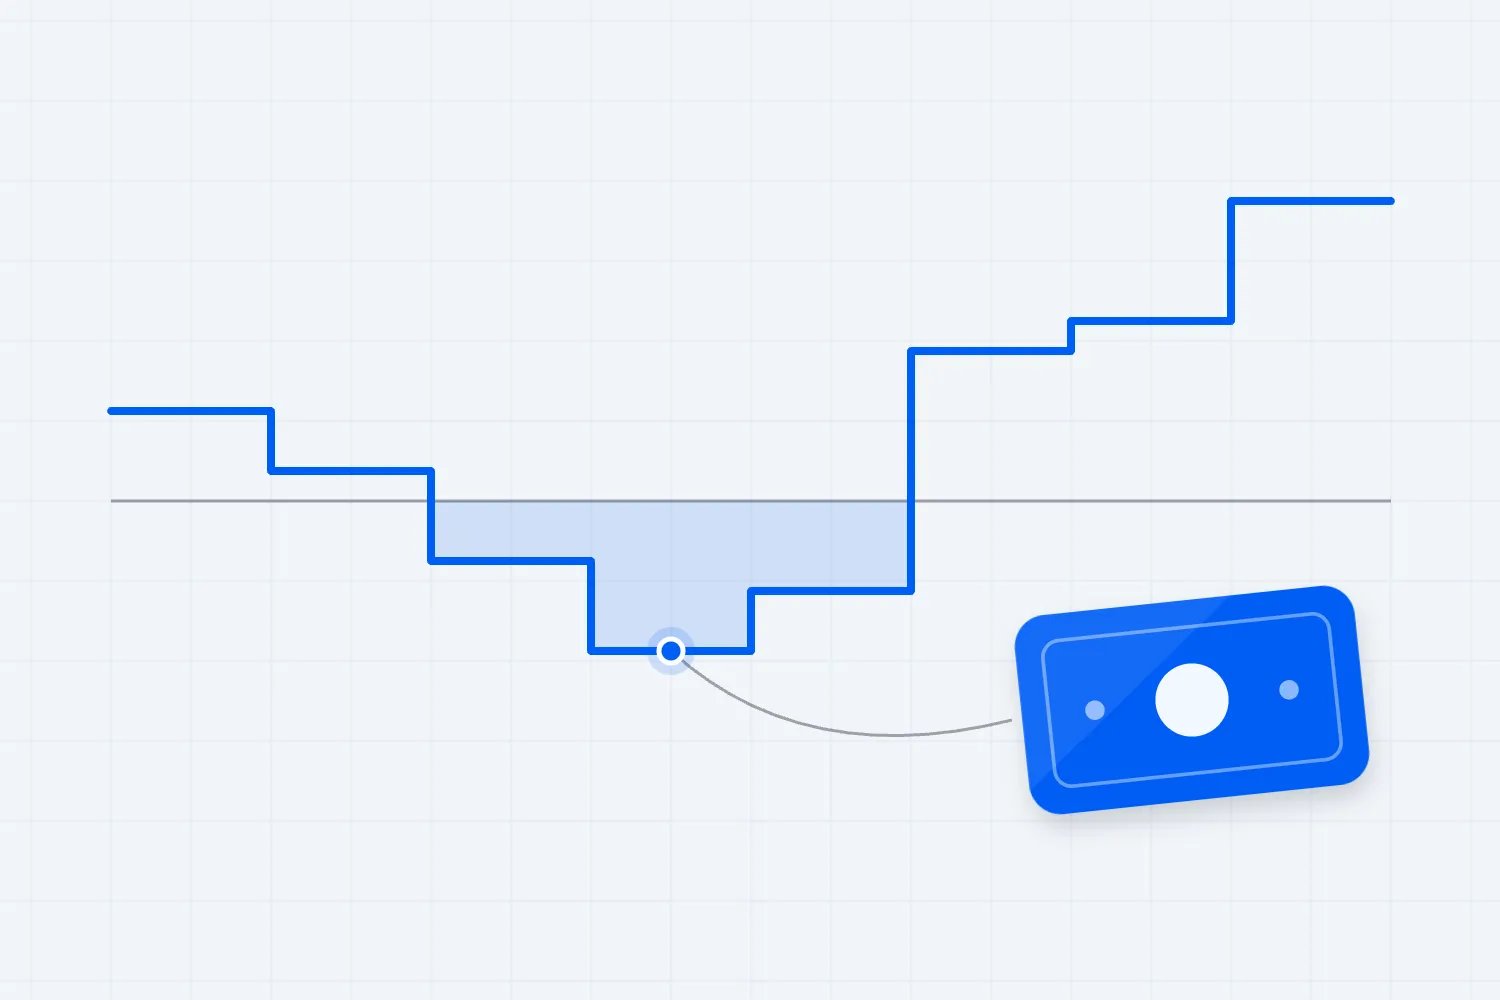
At 300 original paid sales, tickets contribute $11,496. The event still needs $15,160, so it has a $3,664 expected loss. Selling $15,000 of tickets hasn't covered the event because refunds, fees and service costs reduce the money available.
With prices and costs unchanged, another 96 original sales take you to the 396-ticket break-even point. If 300 is your realistic final forecast, you need to close the shortfall another way, such as reducing costs by $3,664 or securing that much additional net sponsorship income. Count any extra spending needed to win more sales before assuming those sales solve the problem.
Example 4. Two ticket releases break even at 358 sales
A single ticket price is useful for learning the calculation. Your event may sell early birds first, followed by a more expensive general release. Don't average those prices across a sellout and assume the same average applies at break-even.
Keep the same $15,160 requirement, 4% refunds, $8 service cost and fictional fee structure. Now sell the first 100 original tickets at $40, followed by tickets at $60. The contribution formula gives $29.02 per early bird and $47.62 per general-release ticket.
The first 100 tickets contribute $2,902. That leaves $12,258 to cover through general release. Divide $12,258 by $47.62, round up, and you need another 258 sales. Total break-even is 358 original tickets, comprising 100 early birds and 258 general-release tickets.
Check the boundary. At 100 early birds plus 257 general-release tickets, the event is $19.66 short. Add one general-release ticket and it is $27.96 above break-even. This assumes the general release opens after those 100 original early-bird sales, and refunds do not replenish the cheaper release.
For more releases, carry the uncovered amount forward after each completed allocation. Stop in the first release that covers it. If the first release alone can cover all costs, divide by that release's contribution instead. Our early-bird allocation guide helps you choose how many cheaper tickets to make available.
General admission and VIP sold together need another approach. Forecast their actual quantities and calculate each contribution separately, including the extra cost of VIP benefits. Add those contributions and compare the total with the costs still to cover.
A weighted average can summarize a forecast when the sales proportions stay consistent. ACCA's cost-volume-profit analysis explains that changing the sales mix changes the break-even result. A plan that needs a particular number of VIP buyers should show that number. An overall ticket target can hide a shortfall in the more valuable category.
Use the answer to make a decision
A feasible break-even number still needs credible demand behind it. Selling 396 tickets is possible within this room's capacity. Whether enough people want this event at $50 is a different question.
Check that each paid sale makes a positive contribution. If it contributes nothing or loses money, selling more cannot cover outstanding costs. If sponsorship already covers all specified costs, you need no ticket sales to break even, but loss-making tickets would still reduce the surplus. Also check the required sales against your paid capacity. In this example, the limit is 570, and we haven't assumed refunded tickets can be sold again.
Compare the requirement with comparable paid sales, the strength of your offer and what you've already sold. Keep a separate forecast of likely sales. Choosing a larger forecast because the budget needs it doesn't produce more buyers.
Test the assumptions you can actually change. In our single-price example, increasing expected refunds from 4% to 8% raises break-even from 396 to 414 original sales. Raising the price from $50 to $55, with the original 4% refund assumption, lowers the requirement to 353. That second result doesn't predict whether demand will hold at $55.
Also check the gap between likely sales and break-even. At the example's forecast of 450 original sales, that gap is 54 tickets. It describes how far sales can fall under the same assumptions before the expected result turns negative. It isn't spare capacity or a fund you can spend. Higher costs or weaker contribution reduce that room immediately.
If you need another $1,000 of fixed spending, keep the original ticket assumptions and increase fixed event costs to $19,000. Break-even becomes 422 sales, leaving a much smaller gap to the 450-sale forecast. The spending might be worthwhile, but approve it with the extra ticket requirement visible. Compare each alternative against the original budget so you can see what caused the change.
| Label | Break-even sales |
|---|---|
| Original assumptions | 396 |
| Refunds at 8% instead of 4% | 414 |
| Price at $55 instead of $50 | 353 |
| Fixed costs up by $1000 | 422 |
Run cost changes separately too. A better supplier quote reduces the amount tickets must cover. Another discount reduces contribution. An added hospitality benefit may make the offer more appealing while increasing both the ticket price and service cost. Recalculate both sides before approving it.
Once sales are underway, use actual ticket quantities and prices for completed sales, then forecast what remains. Refunds already issued are actual costs and revenue reductions. Apply an expected refund allowance only to the sales still exposed to future refunds, so the same refund isn't counted twice.
Keep a dated copy of each approved forecast. Write down which assumption changed and the resulting decision, such as reducing an optional production item or limiting a discount allocation. Assign someone to verify uncertain supplier costs before their commitment deadline. Repeatedly recalculating the same optimistic assumptions won't improve the event's economics; a changed price, cost, confirmed income or credible sales forecast can.
On Loopyah, ticket releases let you set a price and quantity for each release, with the next release opening when the previous one sells out. Put the quantities you've budgeted into that setup. The sales plan and the ticket inventory should describe the same event.
Check when the money arrives
Breaking even doesn't tell you whether you can pay next week's production deposit. A sponsor may owe you money that won't arrive until after the event. Ticket money may also reach your bank later than the purchase date.
Keep the whole-event profit calculation alongside an event cash-flow forecast. The first tests whether income covers costs. The second puts receipts and payments on dates so you can see a cash shortage before a bill comes due.
Include deposits already paid in the full event's costs. They don't disappear because the money has left your account. In a cash forecast starting today, their effect is already in your opening balance, so don't schedule them for payment again.
After the event, replace the forecast with actual sales by ticket type, refunds, fees and final supplier costs. Reconcile ticket counts to retained valid tickets and revenue to the money recorded in your accounts. Investigate the differences instead of carrying the forecast forward as if it happened. Perhaps the average order was smaller, more buyers used a discount or catering costs were committed before refunds arrived. Those details improve the next event's inputs. Keep the original forecast as well, so you can distinguish a weak sales forecast from a cost estimate that changed after the event went on sale.
The number you need is the smallest feasible ticket quantity that covers the event's remaining costs under your actual pricing and cost assumptions. For our single-price example, that's 396 original paid sales for expected break-even and 474 for the chosen profit target. Keep those thresholds beside the sales forecast, update them when the inputs change, and check that the bank dates work too.

Author: By the Loopyah Content Team
The Loopyah Content Team shares expert insights, practical guides, and industry updates to help event organizers create unforgettable experiences and stay ahead in the event planning world.