· 21 min read
How to forecast ticket sales using a sales curve
You've sold 240 tickets, the event is four weeks away, and someone asks whether you're going to fill the room. You can point to the target. You can point to yesterday's sales. Neither tells you how many tickets you're likely to sell by the time doors open.
To build an event ticket sales forecast, compare your current paid sales with the share that genuinely comparable events had sold at the same point. If those events had usually sold 40% of their final total with four weeks remaining, 240 tickets suggests a finish around 600. Then test whether the comparison still makes sense, allow for uncertainty, and update the forecast as new sales arrive.
The useful part is the timing. A quiet week can be normal for an event whose buyers book late. The same week can be worrying when your usual buyers have already made their plans. Your sales curve helps you tell those situations apart, so you can make a commercial decision while there's still time to do something about it.
Decide what you're forecasting before you count sales
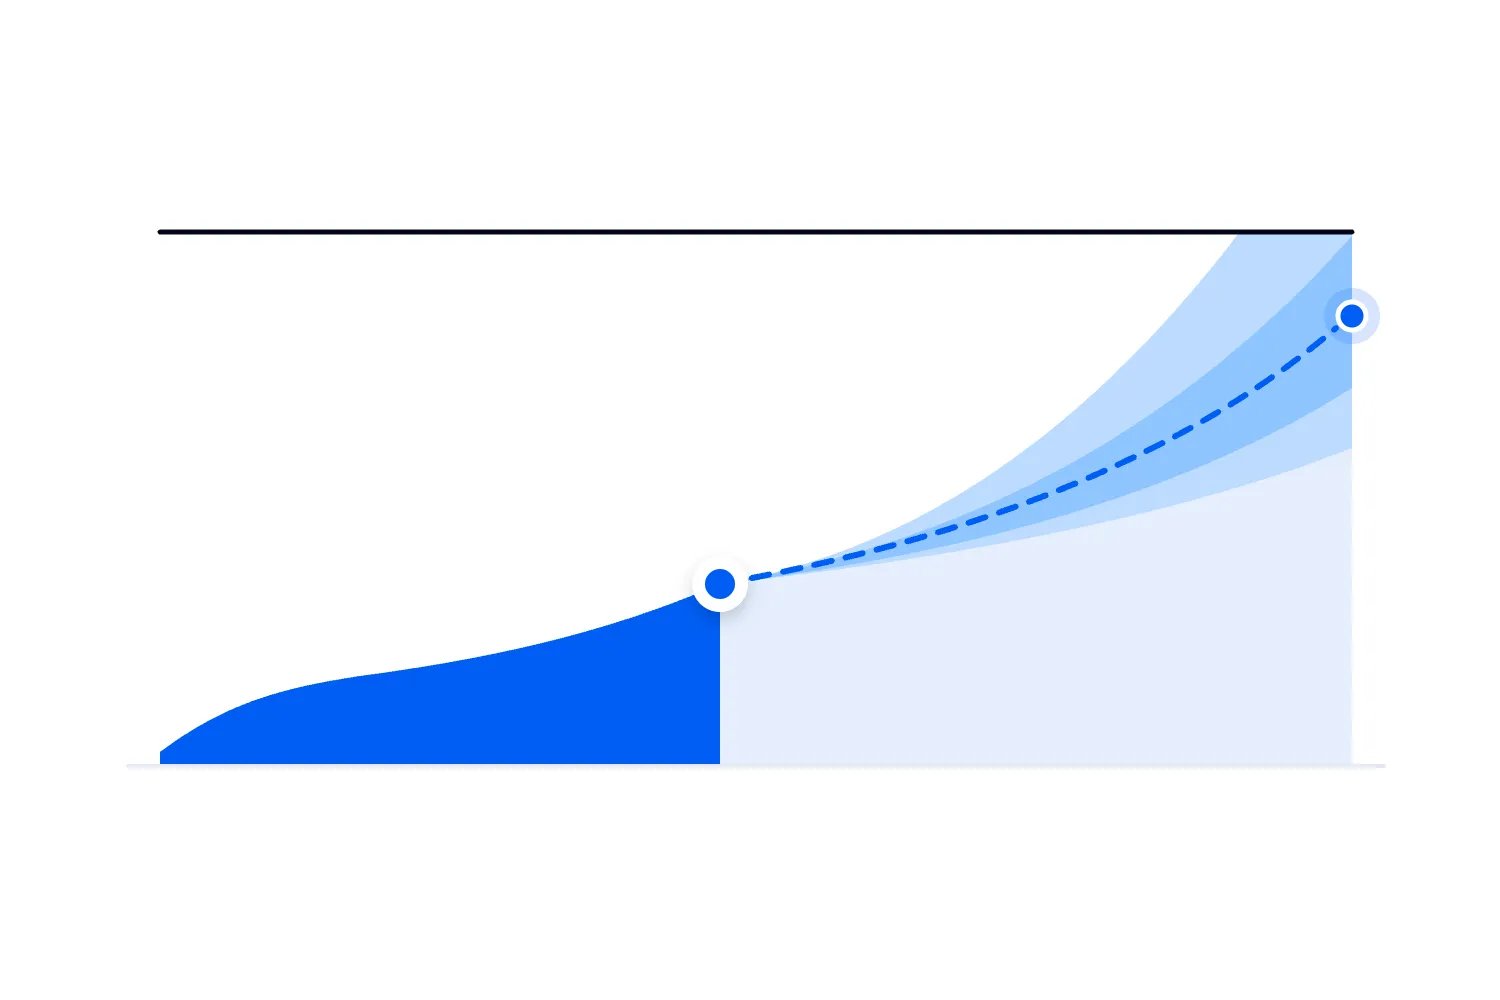
A sales curve shows how tickets accumulate before an event. You put time along the bottom and tickets sold up the side. Each point answers a simple question: how many paid tickets had we sold by this date?
Start by choosing the finish you're trying to predict. For advance marketing decisions, that might be paid tickets retained at the online sales cutoff. For an event with meaningful door sales, you may need a separate forecast for advance sales and another for tickets sold during entry. Mixing the two hides the very timing you're trying to understand.
Count tickets, not orders. A booking for four people is four tickets even though one person paid. Exclude complimentary admissions from the paid sales forecast, then include them separately when planning capacity. A refund that cancels two admissions should reduce the number of paid tickets retained. A partial monetary refund without cancelled admissions changes revenue but doesn't necessarily change the ticket count.
Choose a consistent rule for transfers and resales too. If the same admission changes hands, counting both transactions as new capacity sold exaggerates demand. You're interested in the paid admissions that remain valid, rather than every payment event attached to them.
Write these rules above your working file. They sound fussy until someone compares a current figure excluding refunds with last year's gross issued tickets. The difference looks like weaker demand, and you can spend a whole meeting discussing a problem created by counting differently.
Use your own buying pattern instead of a universal curve
You may have heard that event sales always surge at launch, slow down in the middle, then surge before the event. That can happen. It isn't a reliable assumption for every audience, format or price.
A destination retreat asks buyers to arrange travel and time away. A recurring local music night may involve a much shorter decision. A professional conference can depend on employer approval. Even within your own series, changing the date or announcing the main attraction later can change when people buy.
Hyndman and Athanasopoulos begin Forecasting: Principles and Practice by explaining that predictability depends partly on understanding the factors involved and having relevant data. For your event, that means checking what made previous audiences book when they did before treating their sales history as your likely future.
Don't copy a curve because it looks reassuring. Pull the history for events your buyers would recognise as a similar purchase. A graph built from your own records may be less smooth than a generic illustration, but it tells you something you can investigate.
And don't assume you need advanced software to start. For a small series, a consistent record of paid tickets at weekly checkpoints can support a useful first forecast. The quality of the comparisons matters more than a complicated formula applied to unrelated events.
Choose comparable events before seeing which forecast you prefer
The first thing you want to do is make a shortlist from completed events. Look for similar audience, location, format, ticket price and sales window. Then check the circumstances that could have changed buying behaviour.
Was the main programme announced at launch? Did early buyers get the same discount? Did one event have a large partner allocation? Was the previous edition building on an established audience while the current one is entering a new city? Those differences don't automatically make a comparison useless, but they need to be visible.
Include ordinary performances and disappointing ones when they genuinely match. Keeping only the shows that filled the venue builds optimism into the forecast before you've calculated anything. Equally, don't include a cancelled or radically disrupted event just to make the sample bigger. Explain why each event belongs.
Make the selection before you calculate the answer. Otherwise it's very tempting to discover that the event producing the nicest forecast was also the most comparable. Decide your criteria, save the shortlist, and record exclusions so someone else can follow the reasoning.
With only a few completed events, show each one individually. Don't present the average as though it represents hundreds of observations. Three similar events can help you start, but one unusual edition has a lot of influence in a group that small.
If you run several different formats, keep separate histories. A workshop shouldn't inherit the buying schedule of your festival merely because both use the same ticketing account. You can share the method while using different evidence for each event type.
Line up the dates so you're comparing the same moment
Comparing calendar dates rarely helps. This year's event may happen in November and last year's in September. Instead, compare the number of days remaining until the same sales cutoff.
For an event where advance sales end when doors open, four weeks out means 28 days before doors. For one closing sales earlier, use that earlier cutoff throughout. Pick a timezone and a daily cutoff time too. A report pulled halfway through a busy Friday isn't equivalent to a completed Friday in your historical data.
Start with weekly checkpoints if that's enough for your decisions. You might record sales with eight, six, four, two and one weeks remaining, plus the final count. Close to the event, daily checkpoints can reveal changes that a weekly total conceals.
Opening dates still matter. Suppose last year's tickets went on sale ten weeks before the event and this year's went on sale six weeks before. Four weeks out means six weeks of selling in the first case and two in the second. Aligning the event dates hasn't made those histories equivalent.
Keep days remaining and days on sale in your records. If the sales windows differ substantially, choose closer comparisons or make the difference an explicit assumption. Stretching every campaign to the same percentage of its duration can hide real deadlines such as travel bookings and employer approvals.
You can also note launch, programme announcements, price changes and campaign starts on the history. Those dates help explain a jump. They don't give you permission to assume the same jump will happen whenever you want it.
Clean the history before turning it into percentages
For each comparable event, collect the paid ticket count at your chosen checkpoints and the final paid count under the same definition. Check refunds, cancelled orders, group allocations and periods when tickets weren't available.
A sold-out event needs special treatment. Once there are no tickets available, the sales curve stops describing unconstrained demand. A venue that sold its last ticket two weeks early doesn't prove buyers would have stopped purchasing then if another room had been available.
You can use that history to understand how quickly the available inventory sold. Be careful using its final total as the denominator for a larger event, though. The resulting percentages may make demand look much more concentrated early than it would have been without the capacity limit.
Keep sold-out histories marked separately. If all your relevant editions sold out, say the records support a forecast of how inventory may sell rather than a confident estimate of total potential demand. A waiting list might add context, but joining one isn't the same as paying for admission.
Missing data deserve the same honesty. A blank week can mean no sales, an incomplete report, or a period before launch. Don't quietly turn it into zero. Recover the records where possible and describe unresolved gaps.
The NIST guidance on exploratory data analysis emphasises looking for structure, unusual observations and questionable assumptions. In your working file, this means inspecting the records before averaging them. A formula won't rescue an event history with double-counted admissions or an unexplained sales pause.
Calculate the share sold at each checkpoint
Now divide each event's paid tickets at a checkpoint by its final paid tickets. That gives you the share already sold at that moment. Keep the final totals alongside the percentages so you can still see the scale of the events.
Here's a hypothetical example. Event A had 200 paid tickets with four weeks remaining and finished at 500, so its share was 40%. Event B had 240 and finished at 600, also 40%. Event C had 280 and finished at 700, again 40%. None sold out, and all used comparable sales windows and counting rules.
Their final sizes differ, but their buying timing agrees at this checkpoint. If your current event has sold 240 tickets with four weeks remaining, divide 240 by 0.40. That produces a final forecast of 600 paid tickets, including the tickets already sold.
You aren't forecasting another 600 tickets. You are forecasting another 360, because 240 are already in the total. This is an easy mistake when a team passes the result into a marketing plan or capacity discussion.
For real histories, the shares usually won't agree so neatly. You might use the median, the middle value after sorting them, as a simple starting estimate. Record the smallest and largest shares as well. If you choose an average or weight some editions more heavily, explain why and keep that choice consistent.
The result is conditional on the buying pattern remaining relevant. It isn't proof that the remaining audience exists, or that your current campaign will reach them. That's what the next checks are for.
Read the curve as a timing pattern
The hypothetical chart below shows three completed events. Each series records the cumulative number of paid tickets sold at the stated checkpoint before the final sales cutoff. These are illustrative numbers created for this guide, not research findings or Loopyah customer results.
| Label | Event A | Event B | Event C |
|---|---|---|---|
| 8 weeks | 50 | 60 | 70 |
| 6 weeks | 100 | 120 | 140 |
| 4 weeks | 200 | 240 | 280 |
| 2 weeks | 300 | 360 | 420 |
| Sales cutoff | 500 | 600 | 700 |
The lines have different heights because final ticket totals differ, while the example holds percentage timing constant. At six weeks, the hypothetical events had sold one fifth of their eventual totals. At one week, they still had one fifth to sell. That remaining share follows from the example's assumptions; it isn't a late-sales benchmark for your event.
Your chart may show quite different buying patterns. That's useful. One edition might sell earlier after a strong launch, while another depends heavily on the final week. Look for the reason before deciding which pattern to use.
The authors of Forecasting: Principles and Practice explain time-series graphics as a way to reveal patterns and unusual features. Plotting your events separately can expose a mismatch that disappears in a combined average. Perhaps the edition you thought was comparable had a different sales cutoff, or its late jump came from a partner buying a block of tickets.
Keep a percentage view alongside these ticket counts. It helps compare timing, but a tiny event and a larger one can have identical percentages while placing different demands on your audience and marketing.
Check recent pace before accepting the final number
Let's continue the hypothetical current event. At six weeks remaining, you had sold 160 paid tickets. At four weeks, you have 240. The comparable timing curve says 20% and 40% respectively.
Using the six-week checkpoint alone would have produced a forecast of 800, because 160 divided by 0.20 is 800. Today's calculation gives 600. The forecast has fallen because the current event hasn't followed the same growth between those checkpoints.
That doesn't mean the formula is broken. It means the launch suggested a stronger finish than the following fortnight supported. You sold another 80 tickets, so the headline count improved, while the likely final total under this method declined. That's a useful distinction to take into the meeting.
Now ask what explains it. Was launch unusually strong because repeat buyers acted immediately? Did planned promotion actually run? Did the ticket price change? Was a block of tickets briefly unavailable? Are buyers waiting for information that the comparable events had already announced?
Don't fix the discrepancy by selecting the earlier, happier forecast. Keep the dated forecasts so you can see how the estimate is changing. Use current evidence to decide whether the historical timing still deserves your confidence.
A recent daily sales average can provide another check. If the curve requires a much faster final period than anything your current campaign has achieved, identify what could cause that change. A confirmed announcement has a different evidential weight from a hope that people will buy eventually.
Turn the remaining forecast into checkpoints you can review
A final forecast becomes more useful when you can inspect the route to it. With a forecast of 600 paid tickets and the hypothetical timing shares above, the expected total is 360 with two weeks remaining, 480 with one week remaining, and 600 at the cutoff.
Starting from today's 240, that implies 120 more tickets over the next fortnight. Then another 120 in the following week, and another 120 in the final week. The expected pace increases because that's how this particular example was constructed.
These checkpoints are expectations under your current assumptions. They aren't instructions to manufacture scarcity or promise buyers that the event will sell out. Keep public claims based on real ticket availability and confirmed facts.
At the next review, compare actual paid tickets with the expected count. If you're ahead, check whether the improvement came from repeatable demand or a one-off group booking. If you're behind, check whether a missed campaign, slower checkout completion or a changed audience explains it.
Don't add the old expected increments to whatever count appears next week. Recalculate from the new checkpoint using the relevant historical share, then examine whether that revised final forecast makes sense. Otherwise you're carrying old expectations forward while pretending you've updated them.
Keep your original commercial target visible in another column. If you need 750 paid tickets and the forecast is 600, the target hasn't become 600. You have a gap to address, and changing the target label won't sell the missing tickets.
Show uncertainty without inventing a confidence level
One forecast number is convenient, but buyers aren't following your spreadsheet. Show how the result changes when the remaining buying pattern differs.
Suppose a broader hypothetical comparison set suggests that four-week shares could reasonably be 30%, 40% or 50%. With 240 tickets already sold, those assumptions produce final totals of 800, 600 or 480 respectively. A larger share already sold means fewer tickets remain, so the final forecast is lower.
Those three totals are scenarios, not a statistically validated prediction interval. Don't call the span a 95% confidence range because it looks wide. You haven't established how often future events will land inside it.
The textbook's discussion of scenario forecasting distinguishes plausible situations from a single likely outcome. Use that distinction in your team discussion. Explain what would have to be true for buyers to follow the later-booking scenario, and what could make the earlier-booking scenario more appropriate.
You might keep the 600 forecast as your working estimate while planning a supplier decision against 480. Another decision, such as whether you can safely admit more buyers, must respect capacity even if the upside looks higher.
If sellable inventory is 700, an 800 demand scenario doesn't create permission to sell 800 admissions. Cap the feasible sales forecast at available inventory and retain the larger demand estimate separately, if useful. Make the capacity calculation after accounting for complimentary tickets, reserved allocations and any other admissions using the same space.
Connect the forecast to a decision with a deadline
A forecast is worth maintaining when it changes what you do. Pick the next decision that depends on ticket demand and write down the date it becomes expensive or impossible to change.
Maybe a supplier needs the final order next Tuesday. Maybe additional staff can still be cancelled this week. Maybe there's a smaller room available, but only until the venue confirms another booking. The forecast helps you weigh those decisions while the alternatives still exist.
Use your event budget to establish how different paid attendance levels affect the event's result. If the lower scenario creates a loss you cannot accept, decide which costs can change and which sales action has a credible chance of improving demand. Don't wait for the event to finish before acknowledging the issue.
For marketing, compare the remaining sales required with the budget and time available. A forecast below target doesn't automatically justify more advertising. You still need a reasonable expectation that additional spend can produce enough additional paid tickets to help.
Our event marketing budget guide develops that spending decision. Here, the forecast supplies the quantity and timing problem you're trying to solve. Keep your explanation specific: which audience, which offer, which action, and how soon you expect to see paid sales change.
Avoid an automatic discount whenever a curve falls behind. If price isn't the reason people haven't booked, cutting it reduces revenue without resolving the problem. Check the purchase barriers first, then use your ticket pricing strategy to consider the effect on both sales and income.
Keep ticket volume and ticket revenue separate
A ticket count forecast doesn't tell you what those tickets will earn. Buyers may choose different ticket types, buy at different release prices or use discounts. Forecast revenue using the likely mix, rather than multiplying every admission by the most attractive advertised price.
For another hypothetical calculation, suppose today's 240 retained paid tickets represent $10,800 in ticket revenue. You forecast 360 additional tickets averaging $50 after discounts, before taxes and fees. The additional revenue would be $18,000, giving $28,800 in total on that stated basis.
Multiplying all 600 forecast tickets by $50 would produce $30,000 and overstate this example by $1,200. It replaces the revenue you've already earned with a different assumed price. Preserve actual revenue for completed sales and apply assumptions only to the tickets still to come.
| Label | Actual revenue from 240 tickets sold | Assumed at $50 a ticket |
|---|---|---|
| 240 actual + 360 at $50 | 10800 | 18000 |
| All 600 at $50 | 0 | 30000 |
If you sell several meaningful ticket categories, forecast them separately when their buyers behave differently. A premium package might book early while general admission sells later. Pooling them can make a healthy total count conceal weak sales of the package your budget depends on.
Don't split the forecast into so many small categories that each is based on almost no history. Start with the distinctions that affect a real decision, and reconcile the category totals back to the event total.
Bank receipts need their own dates and deductions. Our event cash-flow forecast guide covers when money becomes available to pay bills. Keep that work connected to this sales estimate, while remembering that tickets sold today and money available today can differ.
When history is weak, make the assumptions visible
For a first edition, a new city or a much larger venue, you may not have a sales curve that deserves to drive the forecast. Say that plainly. Borrowing a familiar event's timing doesn't make its audience transfer to your new offer.
Use the closest relevant comparisons to build provisional scenarios, then explain the differences. Add current paid sales, confirmed group purchases and evidence from the actual campaign. Treat expressions of interest, email subscribers and waiting-list names as possible buyers, rather than paid tickets.
A launch can teach you about demand, but its first few days may mostly reflect the audience already waiting for the announcement. Extending that pace across the whole sales window assumes new buyers will keep appearing at the same rate. Check that assumption against the size and accessibility of the remaining audience.
Where a programme announcement or partnership may change demand, record the commitment and date. Keep the forecast without that change available until the action happens. A partner's intention to promote is weaker evidence than a confirmed paid allocation, and either needs accurate counting.
You can improve the next edition's forecast by keeping consistent daily or weekly snapshots now. Record the sales window, meaningful changes and final paid total. That small habit produces better evidence than reconstructing an event from scattered reports months later.
For this edition, choose commitments you can revise where possible. The uncertainty is a reason to retain options, especially when the commercial consequence of a wrong forecast is large. It isn't a reason to pretend there will be no late buyers or unlimited late buyers.
Check whether your method would have worked last time
Before relying heavily on the curve, test it against completed editions. Pretend you were forecasting an earlier event with four weeks remaining. Use only the relevant events and information that existed before that review date, then compare the forecast with the actual final paid total.
Repeat at the checkpoints where your business makes decisions. A method that performs acceptably one week before doors may be too unreliable six weeks out, when you must commit production spending. Keep the errors separate by forecast timing.
The authors' guidance on evaluating forecasts stresses testing against observations that weren't used to fit the method. For your series, don't let the very event you're pretending to predict help define its own comparison curve. That would make the test look better than a real forecast could have been.
Record the signed difference and the size of the miss. If you forecast 600 and sold 540, you overestimated by 60 tickets. If you forecast 600 and sold 660, you underestimated by 60. Both miss by the same amount, but persistent overestimation has a different practical consequence when you order against the higher number.
Compare the curve method with a simple alternative, such as repeating the last comparable edition's final total. Complexity should improve decisions enough to justify the extra work. If a simple method performs better, use it while investigating why your timing comparison fails.
Save the forecasts before the event concludes. Recreating what you think you would have predicted afterwards makes it too easy to tidy away the inconvenient assumptions.
Review the forecast using current sales records
Give large group orders a short explanation in the review record. A single employer buying 40 places can move the total sharply without telling you much about individual demand. Keep the paid tickets in the count, but avoid assuming another employer will repeat that purchase next week. If an allocation is unpaid or only agreed, record it separately until it meets your counting rule.
Check reporting delays before reacting to an apparent slowdown. If you sell through more than one channel, use the same cutoff across them and confirm that their records have arrived. A missing report can make Friday look disappointing and Monday look extraordinary when the buyers actually paid throughout the weekend. Explain corrections to snapshots so the team understands why a historical checkpoint changed.
Agree who can revise the assumptions and who decides the action. Everyone can challenge the forecast, but keeping several undocumented versions creates confusion. Save the reason for each adjustment, especially when it increases expected sales. That makes the next review a continuation of the decision instead of another argument.
Keep one dated review record showing current paid tickets, the chosen comparisons, the share used, the resulting final estimate and the next checkpoint. Add the scenario assumptions and the decision you're making before the next review. Someone covering for you should be able to understand the estimate without rebuilding it.
Loopyah's ticketing and sales analytics show ticket sales and which sources sold tickets. Use those current records to check whether actual purchases are moving after your campaign changes. You still choose the comparable events, forecast assumptions and commercial action described here.
At the next review, update the count, explain any change in the forecast, and check the assumption most likely to affect your pending decision. Keep doing that at a rhythm that matches how quickly you can act. A weekly review may suit a long campaign; a supplier deadline or the final selling period may require a closer look.
Start with the next commitment you need to make. Calculate the likely final paid total from a comparable checkpoint, show the plausible alternatives, and decide what you can safely commit before the next sales update arrives.

Author: By the Loopyah Content Team
The Loopyah Content Team shares expert insights, practical guides, and industry updates to help event organizers create unforgettable experiences and stay ahead in the event planning world.